- Read more about Characterizing unobserved factors driving local field potential dynamics underlying a time-varying spike generation
- Log in to post comments
Neural spiking responses are generated by both extrinsic covariates such as sensory variables and intrinsic covariates such as those rep-resenting the state of a system. Although the external covariates can be directly controlled or measured; the internal factors are hard, if not impossible, to control or even observe. This study provides a statistical framework that enables characterization of the unobserved factors controlling neuronal response variability induced by behavior, with the model parameters fitted directly to real spiking data.
- Categories:
 38 Views
- Read more about StationPlot: A New Non-stationarity Quantification Tool for Detection of Epileptic Seizures
- Log in to post comments
A novel non-stationarity visualization tool known as StationPlot is developed for deciphering the chaotic behavior of a dynamical time series. A family of analytic measures enumerating geometrical aspects of the non-stationarity & degree of variability is formulated by convex hull geometry (CHG) on StationPlot. In the Euclidean space, both trend-stationary (TS) & difference-stationary (DS) perturbations are comprehended by the asymmetric structure of StationPlot's region of interest (ROI).
- Categories:
 288 Views
- Read more about POLARITY INVARIANT TRANSFORMATION FOR EEG MICROSTATES ANALYSIS
- Log in to post comments
Electroencephalography (EEG) has been widely used in human brain research. Several techniques in EEG relies on analyzing the topographical distribution of the data. One of the most common analysis is EEG microstate (EEG-ms). EEG-ms reflects the stable topographical representation of EEG signal lasting a few dozen milliseconds. EEG-ms were associated with resting state fMRI networks and were associated with mental processes and abnormalities.
- Categories:
 33 Views
- Read more about Contact Surface Area: A Novel Signal for Heart Rate Estimation in Smartphone Videos
- Log in to post comments
Smartphone video-based measurement of heart rate typically uses photoplethysmography (PPG). Prior accuracy studies report low mean absolute errors for apps based on contact PPG on a fingertip, but substantial errors on a troubling percentage of measurements. In this study, we aimed to reduce the rate of substantial heart rate estimation errors by introducing a novel signal present in fingertip videos: fingertip contact surface area.
- Categories:
 8 Views
- Read more about ADAPTIVE CSP FOR USER INDEPENDENCE IN MI-BCI PARADIGM FOR UPPER LIMB STROKE REHABILITATION
- Log in to post comments
- Categories:
 17 Views
- Read more about ELECTROPHYSIOLOGICAL SIGNAL PROCESSING FOR INTRAOPERATIVE LOCALIZATION OF SUBTHALAMIC NUCLEUS DURING DEEP BRAIN STIMULATION SURGERY
- Log in to post comments
globalsip.pdf
- Categories:
 218 Views
- Read more about OVERT SPEECH RETRIEVAL FROM NEUROMAGNETIC SIGNALS USING WAVELETS AND ARTIFICIAL NEURAL NETWORKS
- Log in to post comments
Speech production involves the synchronization of neural activity between the speech centers of the brain and the oralmotor system, allowing for the conversion of thoughts into
- Categories:
 17 Views
- Read more about Low-Complexity Compressed Analysis in Eigenspace with Limited Labeled Data for Real-Time Electrocardiography Telemonitoring
- Log in to post comments
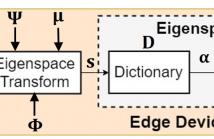
To achieve real-time electrocardiography (ECG) telemonitoring, we need to overcome the scarce bandwidth. Compressed sensing (CS) emerges as a promising technique to greatly compress ECG signal with little computation. Furthermore, with edge-classification, we can reduce the data rate by transmitting abnormal ECG signals only. However, there are three main limitations: limited number of labeled ECG signal, tight battery constraint of edge devices and low response time requirement.
- Categories:
 24 Views
Canonical correlation analysis (CCA) is a data-driven method that has been successfully used in functional magnetic resonance imaging (fMRI) data analysis. Standard CCA extracts meaningful information from a data set by seeking pairs of linear combinations from two sets of variables with maximum pairwise correlation. So far, however, this method has been used without incorporating prior information available for fMRI data. In this paper, we address this issue by proposing a new CCA method named PCCA (for projection CCA).
- Categories:
 23 Views
- Read more about Multilevel Illumination Coding for Fourier Transform Interferometry in Fluorescence Spectroscopy
- Log in to post comments
Fourier Transform Interferometry (FTI) is an interferometric procedure for acquiring HyperSpectral (HS) data. Recently, it has been observed that the light source highlighting a (biologic) sample can be coded before the FTI acquisition in a procedure called Coded Illumination-FTI (CI-FTI). This turns HS data reconstruction into a Compressive Sensing (CS) problem regularized by the sparsity of the HS data. CI-FTI combines the high spectral resolution of FTI with the advantages of reduced-light-exposure imaging in biology.
- Categories:
 9 Views